
Tata Consultancy Services Ltd (TCS)
Basic Stock Details
| Stock Name | Tata Consultancy Services Ltd (TCS) |
| NSE Code | TCS |
| Current Price | Rs 2,270 (as on 26 Aug 2026) |
| Down from 1 Year Ago | ~25% (stock has declined from a year back) |
| Down from All-Time High | ~50% (all-time high was Rs 4,592, hit in Aug 2024) |
PE Ratio Check
| Current PE | ~16.6x |
| PE 1 Year Ago | ~27x (down about 38-39% from there) |
| 3-Year Average PE | ~28x -> current PE is about 40% below this |
| 5-Year Average PE | ~28x -> current PE is about 41% below this |
The Stock is currently trading at 25% discount from its 1 year high & 50% down from all time high. It’s PE has come down in a genuine, consistent fashion, with the fall from its all-time high being the steepest among comparable large-cap peers (~50%). The de-rating has been slow and steady over the last year or two, driven mainly by broader IT sector headwinds.
Sales Growth & Profit Growth (Last 5 Years)
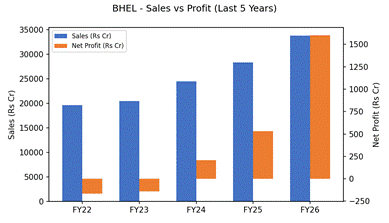
Rs Crore, as reported, rounded off:
Both sales and profit have grown every year, so there’s no earnings problem here – the issue is that the growth rate itself has slowed down a lot. Sales have grown at roughly an 8-10% CAGR over the last five years, which screener flags as “poor” for a company of this scale and size. So the market has re-rated the stock down mainly because it now expects TCS to grow more like a mature, slow-growing IT major rather than the double-digit compounder it used to be.
Conclusion – Cheap or Not?
TCS is trading about 40% below its own 3-year and 5-year average PE. Profits have grown steadily every year in this period, so the discount remains real and calculable, not affected by a low or unstable earnings base.
That said, our assessment is that this discount is at least partly justified by slower growth, not purely a case of the market being irrational. IT services demand globally has cooled off, and TCS own growth numbers reflect that. Overall, we view TCS as CHEAP relative to its own history, representing a fair discount for genuinely slower growth rather than a screaming bargain.
Disclaimer
We collected all data used in this report from various publicly available websites (Screener, Trendlyne, Kotak Neo, Ticker tape, 5paisa, IndMoney, Business Standard, company filings, etc.). We have taken precautions to present this data accurately, but figures may vary across sources by date and data basis.
This report has been prepared purely for educational purposes as part of a research practice exercise. It is NOT a stock recommendation, and should not be treated as investment advice. Please do your own due diligence or consult a registered financial advisor before making any investment decision.
Research By
Gantavya
Research & Market Analysis Intern