

Stock Name. Hindustan Unilever Ltd (HUL)
Summary
Detailed Research
NSE Code. HINDUNILVR
Current Price. Rs 2,028 (as on 20 Aug 2026)
Down from 1 Year Ago
~16% to 19% (price/mkt cap is lower than a year back)
Down from All-Time High
~33% (ATH was around Rs 3,035, hit in 2024)
PE Ratio Check
Current PE
~31.8x
PE 1 Year Ago
~55x (down about 42-43% from there)
3-Year Average PE
~54x -> current PE is about 41% below this
5-Year Average PE
~57x -> current PE is about 44% below this
Detailed Research
So on pure PE basis, HUL is trading way below where it usually trades. Question is whether this is because the business got worse, or because the price just hasn’t kept pace with earnings. Checked that below with the sales/profit numbers.
Sales Growth & Profit Growth (Last 5 Years)
Rs Crore, standalone/consolidated numbers as reported, rounded off:
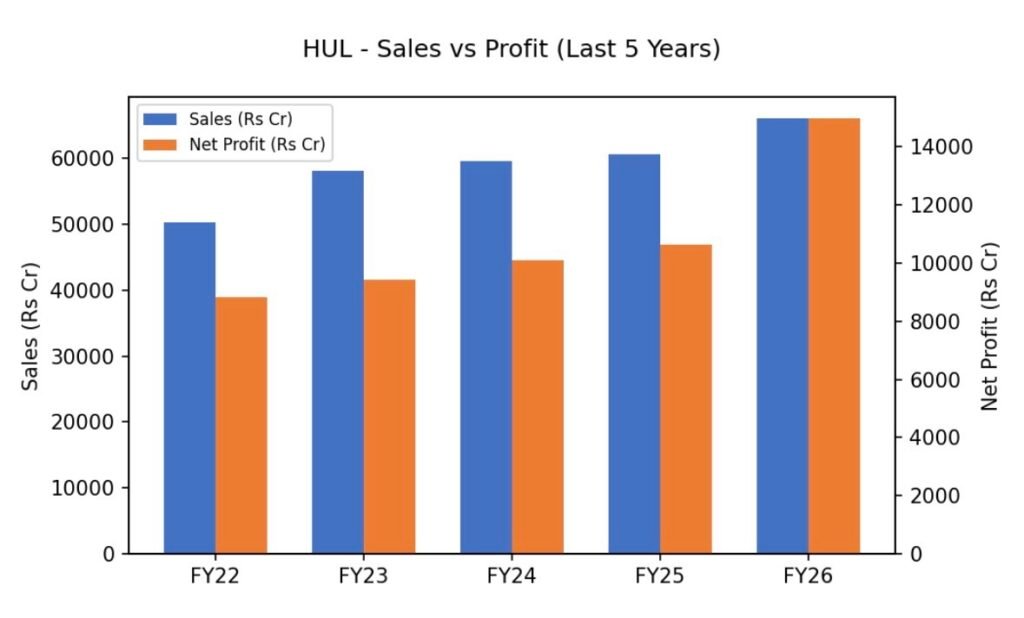
Sales have grown pretty slowly overall – roughly 6-7% CAGR over 5 years, which screener itself flags as “poor sales growth.” Profit line looks a lot better, especially the jump in FY26, but that jump is large enough that it’s probably not pure operating improvement – there may be some one-off or other income boosting it, so we wouldn’t extrapolate that growth rate forward without checking the annual report notes properly.
Conclusion – Cheap or Not?
Based on this data, HUL does look statistically cheap versus its own history – current PE is roughly 40-44% below its 3yr and 5yr average. This isn’t a value trap situation either, since profits haven’t collapsed – profit has actually kept growing (even if the last year’s jump needs a closer look). Price has simply not kept up.
In our view, HUL appears CHEAP on a relative basis, mainly because the market has de-rated FMCG stocks in general over the last year or two (slow volume growth, rural demand issues), not because HUL’s own numbers broke down. Whether that discount closes depends on FMCG demand picking back up, which isn’t something a PE ratio alone can tell us.
Disclaimer
All data used in this report has been collected from various publicly available websites (Screener, Trendlyne, NSE/BSE, Bajaj Broking, Kotak Neo, Business Standard, company filings, etc). Enough precaution has been taken to present this data correctly, but figures can vary slightly across sources depending on the date and data basis used.
This report has been prepared purely for educational purposes as part of a research practice exercise. It is NOT a stock recommendation, and should not be treated as investment advice. Please do your own due diligence or consult a registered financial advisor before making any investment decision.
Research By
Gantavya
Research & Market Analysis Intern